Loading
Homepage
  • Client:  Jdublin
  • Date:  277
  • Power BI

Financial Dashboard

At Sabhi Dev, we’ve developed an innovative Power BI dashboard that offers a comprehensive view of our financial and address analysis. Designed to provide a seamless user experience, this dashboard is powered by MySQL and features dynamic visuals that adapt based on user interactions.

The dashboard's standout feature is its interactive card-based design. Each card is linked to a specific dataset and contains a button with the card's name. When a user clicks on a card, the corresponding visual dynamically updates to reflect the data associated with that card. This allows users to effortlessly toggle between different data perspectives without navigating away from the main dashboard.

For instance, in the Financial Analysis section, users can switch between various financial metrics like revenue, expenses, and profit margins, simply by selecting the relevant card. Similarly, the Address Analysis section provides detailed insights into location-based data, with the visual changing to display maps, charts, or tables as needed.

This level of interactivity not only enhances data exploration but also empowers decision-makers to quickly extract actionable insights from the underlying data. By leveraging the power of MySQL and Power BI, we’ve created a tool that is both flexible and user-friendly, ensuring that our team can stay ahead in analyzing and understanding complex datasets.

Visual identity design

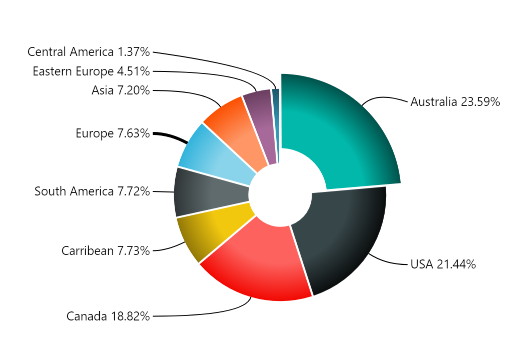
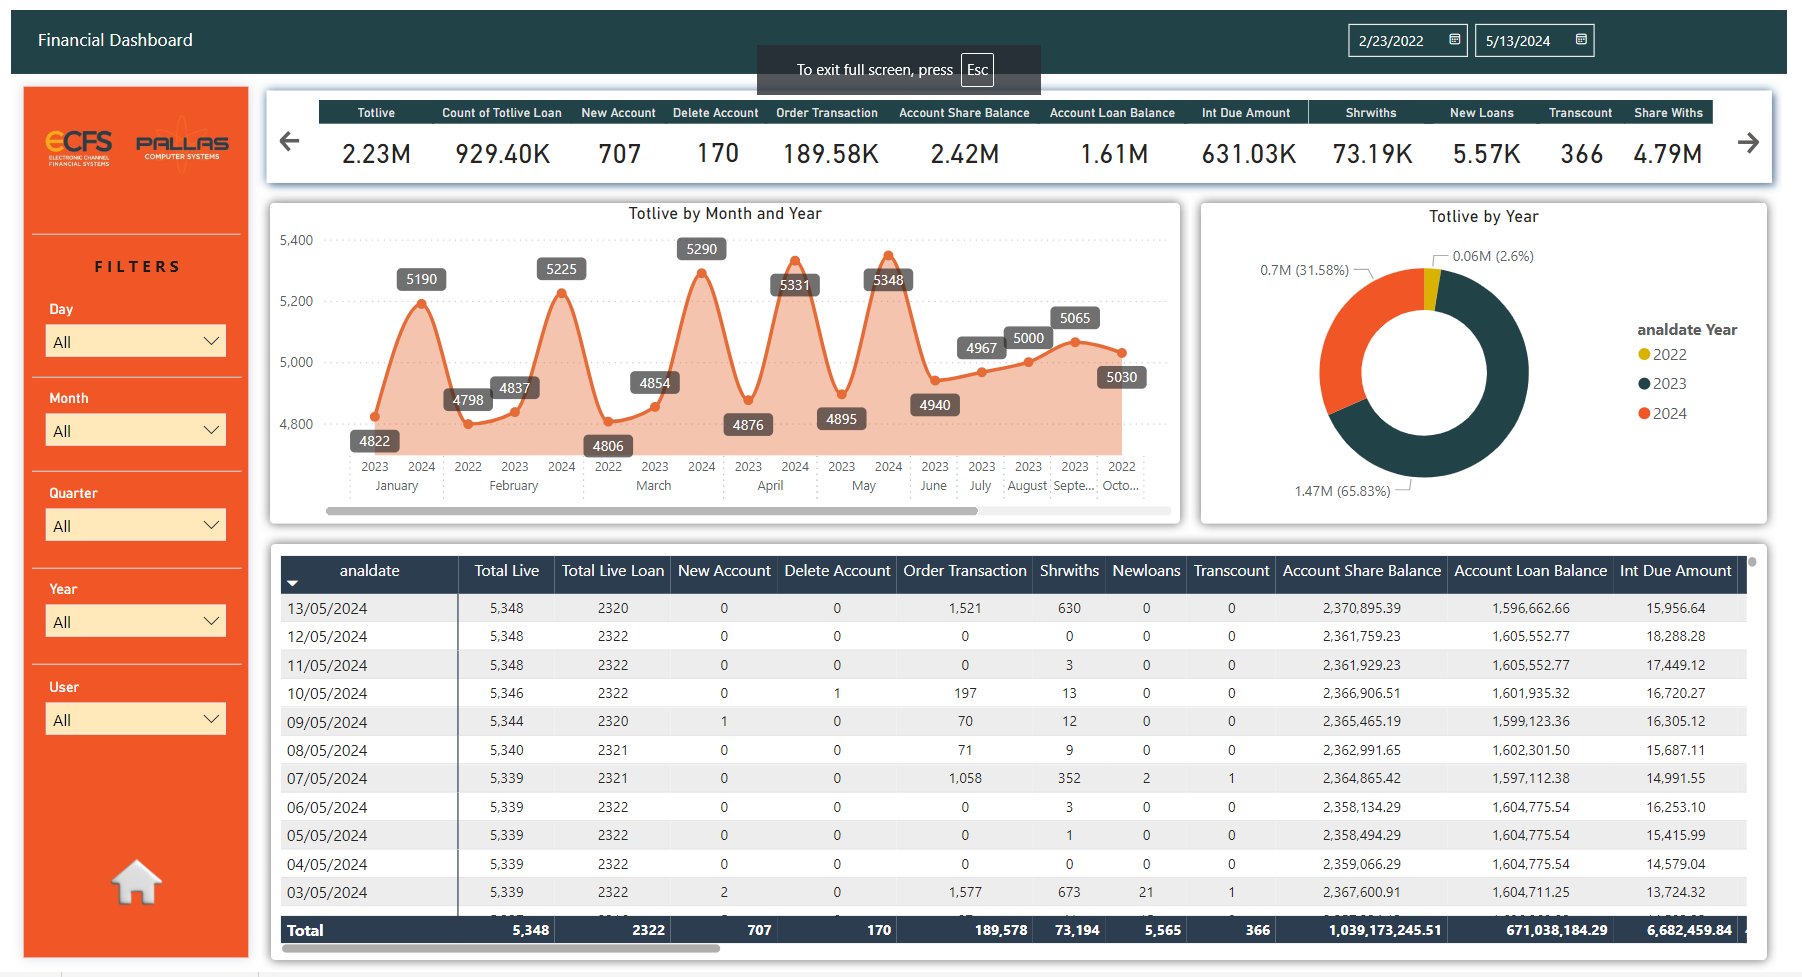
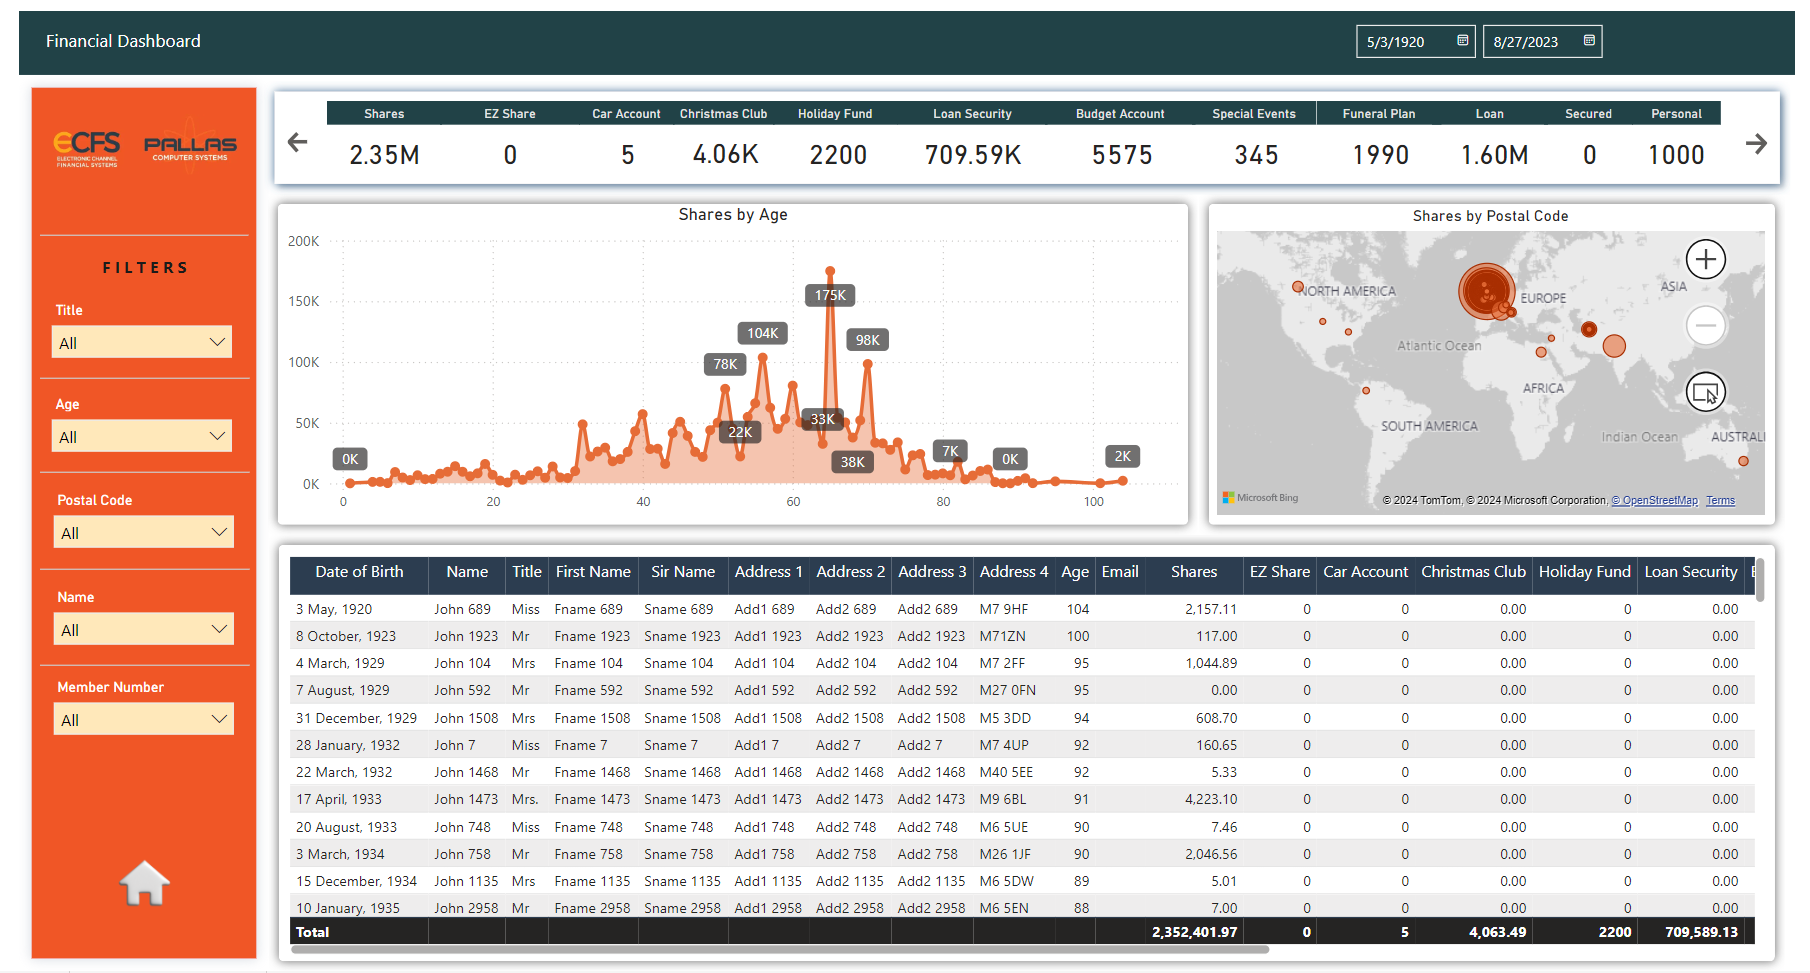
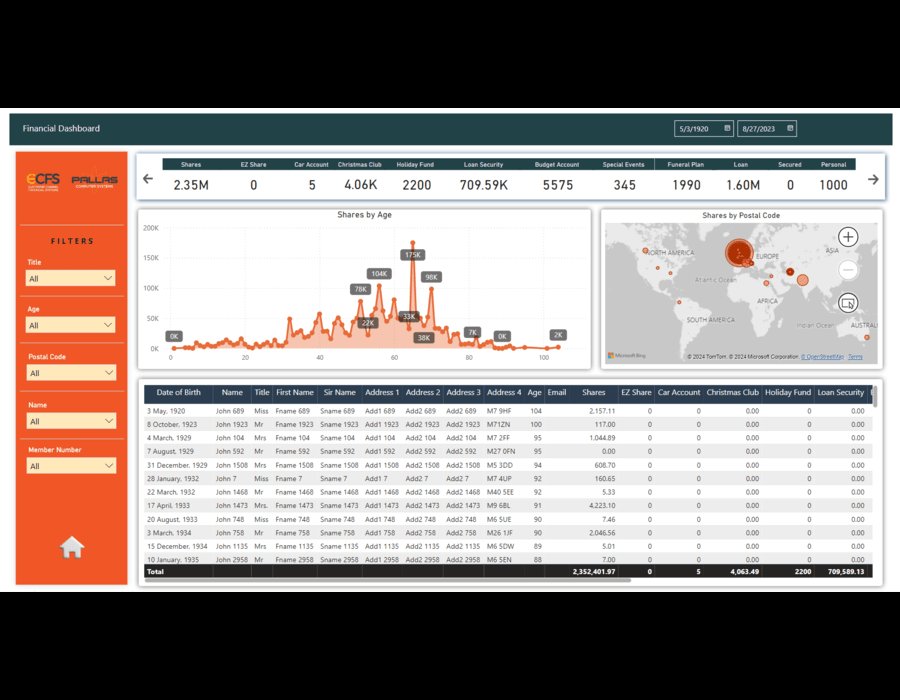
At Sabhi Dev, our Power BI dashboard stands out with its dynamic visual design, offering a blend of functionality and style. Central to this is a Map visual with a dynamic theme, adapting to user interactions and providing real-time geographic insights.

The dashboard also features a responsive line chart, offering a clear view of trends that adjusts with selected data. Additionally, a dynamic table allows real-time data edits, keeping information relevant and up-to-date.

This combination of interactive elements and cohesive design makes our dashboard both visually engaging and highly user-friendly, ensuring a seamless experience for decision-makers.


Similar projects

Ready to bring your ideas to life? I'm here to help

© Sabhi 2023. All rights reserved.

Developed by: Syed Sabhi Hussain

+
+